Part 5/5: How can energy be restructured to improve self sufficiency and reduce emissions?
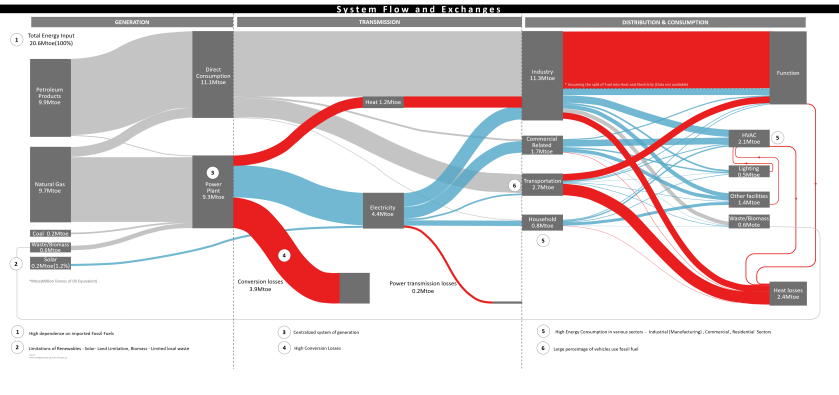
The 4 parts of the series till now outline the existing Energy system of Singapore – its timeline, characteristics, issues. We saw a Sankey diagram in Part 3/5 detailing existing flows and exchanges, while Part 4/5 elaborated on the System Structure at 3 scales.
This final part talks of an ‘After‘ Scenario where we propose a ‘Restructuring‘ to address issues and gaps – to improve self sufficiency and reduce emissions.
The issues at hand which create possible vulnerabilities are –
- a Gap at the neighborhood scale
- a largely Centralized system
- large consumption for air-conditioning loads
- high dependence on imported fossil fuels
Below we see the ‘Before’ and ‘After’ scenarios expressed as Sankey diagrams. We first try to Reduce Consumption, and later address Generation needs. We can see these changes simultaneously in the two diagrams.
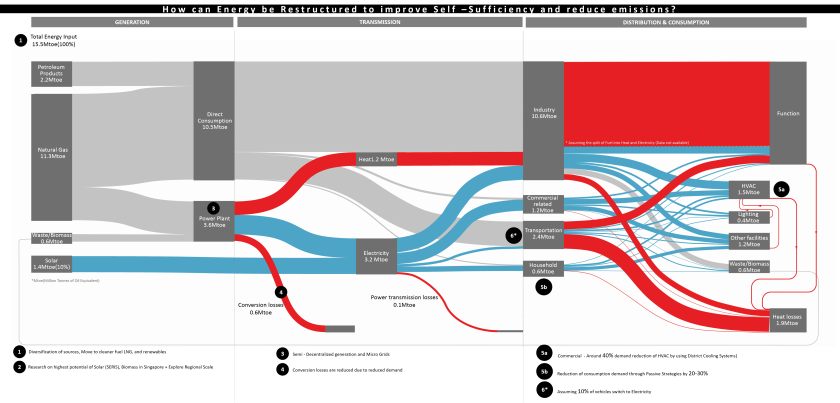
CONSUMPTION REDUCTION –
First, there are few existing District Cooling Systems (DCSs). We therefore, explored DCSs in Singapore and other places like Hong Kong and Tokyo, to understand the scale, capacity and possible energy savings, compared to traditional air-conditioning systems in individual buildings. Based on these studies we assume a possible energy saving of around 40 per cent for Air-Conditioning from commercial consumption.


Second, based on our studies of breathability, integration with green and blue and other Passive strategies (Part 4/5), we assume reduction of 20-30 per cent in consumption load for all buildings.
Third, since majority of vehicles are using petroleum products, we assume, at least 10 per cent could transfer to electricity in the next few years.
This third part actually increases electricity consumption, but overall electricity demand comes down from 4.4 to 3.2 units i.e. by around 30 per cent.


Using this reduced consumption base, we now address Generation.
GENERATION –
For direct consumption, there is high dependence on imports and fossil fuels.
There is already diversification of sources of imports from countries like Australia, Qatar, Russia and a move to cleaner fuels like Liquefied Natural Gas.
We further assume some direct consumption shifting from Petroleum Products to Natural Gas. Thus, the Sankey shows a change from petroleum products to natural gas.

For electricity generation, earlier it is a predominantly centralized system relying largely on natural gas. There was a generation gap at the neighborhood level. So, we explored micro-grid projects in Japan and Singapore.


In the new scenario, we assume a Semi-Decentralized structure, with Micro-grids located, corresponding to future proposed commercial and business clusters in Singapore. These micro grids would rely mainly on Solar capacity (which goes up by 7 times), but also act as research test beds for other technologies like wind, tidal, energy storage. Conversion losses are also reduced due to lower demand.

Here we see diagrams showing the ‘Before’ and ‘After’ scenarios of the System Structure.


To summarize with some interesting numbers. Self-sufficiency (of Singapore for Energy) overall goes up from, 4 to 13 per cent.
For Electricity generation, self -sufficiency rises from , 11 per cent to greater than 50 per cent.
So, in conclusion, all these scenarios for the ‘After’ system are addressing Vulnerabilities, and also bridging Gaps in the existing system — to bring about greater Resilience and move towards Self – Sufficiency and Lower Emissions – thus moving towards our original System Purpose (Part 1/5).
We hope you enjoyed this final post, of our series elaborating on the Energy System of Singapore. Do let us know your thoughts about the Red system and other related aspects in the comments section. We would love to take this discussion further!
Credits:
Graphics : All graphics are produced as part of a team project for M.Sc. Integrated Sustainable Design at National University of Singapore (Building Semester – Stage 1 – Complex Living Systems). Group Members – Gajender Kumar Sharma, Aditi Bisen, Huang Hongbo, Zhao Yanming
Script : Aditi Bisen
References/ Additional Reading:
Looking back at the series, we felt Energy @ the ‘Building Scale’ merited further mention. Thus starting next week, for the next 8 weeks, we will be publishing a chain of posts focused on this important scale –
11th June 2018 – Energy @ the ‘Building Scale’
18th June 2018 – Segment 1/7: Industrial – Cleantech One
25th June 2018 – Segment 2/7: Commercial – Park Royal hotel
2nd July 2018 – Segment 3/7: Commercial – Capita Green
9th July 2018 – Segment 4/7: Residential – Skyville
16th July 2018 – Segment 5/7: Residential – Interlace
23rd July 2018 – Segment 6/7: Institutional – School of the Arts
30th July 2018 – Segment 7/7: Institutional – Khoo Teck Puat Hospital
For updates about our weekly articles, you could Follow us by clicking the ‘Follow The Architecture Gazette‘ button in the right column.
Thank you.

One thought on “Part 5/5: The Red System (Energy), Singapore”