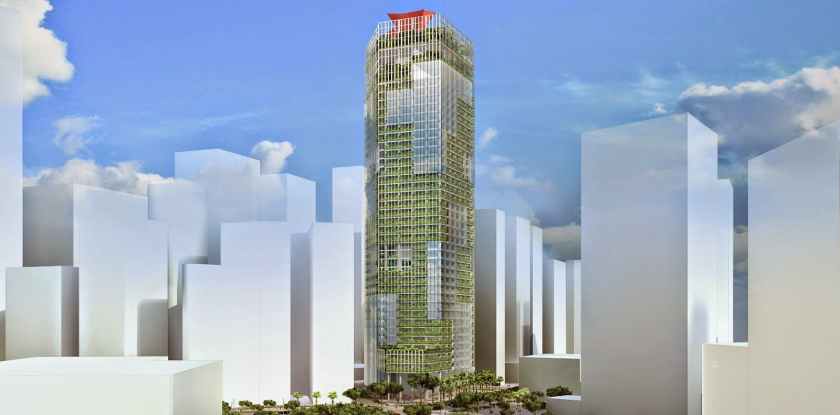
CapitaGreen is a 82,000 sq.m., 43-floor skyscraper in the Central Business District of Singapore1. The Video looks at its design for Sustainable Ventilation.
45 m1 tall Wind-Catchers atop the skyscraper are oriented towards the prevailing wind direction2. Designed to scoop winds at this elevation, they channel air down a core known as the ‘Cool Void’3. Air from the cool void spreads horizontally through the levels, reducing Air-Conditioning loads.
While researching various Passive Strategies and Technologies for the Building Envelope, we came across ‘Cool Roofs‘. We realized that this is a simple, low cost technology with large potential benefits. These include – Energy savings, Reduction of Urban Heat Island Effect and Greenhouse Gas Emissions, enhanced Durability of roofs, and Resilience to extreme heat 1.
Thus, this week’s Article and Video are dedicated to this important idea. The Video 2 , 3 , 4 outlines the Need for Cool Roofs and how they Protect Buildings. In the Article, we cover Initiatives by various parties working in the direction. We also look at some successful Case-Studies that could become models for future developments.
Due to multiple possible benefits, the technology has caught the attention of International actors, Indian central, state and local governments, as well as the Private sector. Their attempt is to use Cool Roofs for large scale Impact at the Building and Urban scales.
Initiatives
The Bureau of Energy Efficiency [(BEE), Government of India, Ministry of Power], has prepared a ‘Cool Roof Design Manual‘ 2 to spread technical information about Cool Roofs for the Composite Climate Zone of India.
A Fact Sheet5 and Issue brief6 have been released by Natural Resources Defense Council (NRDC) and Partners to showcase local projects, and to spread the message, so that action can be scaled up.
Green Building Rating systems like LEED, GRIHA, IGBC need compliance with the Energy Conservation Building Code (ECBC) norms. ECBC specifies minimum cool roof values (reflectance and emittance), for roofs with different slopes 6.
IIIT Hyderabad Cool Roof Calculator – The simulation tool by IIIT Hyderabad, uses a base and design case for testing various roof conditions in certain cities of India. A percentage change in cooling energy can be compared 2, 7.
The above efforts are helping common people as well as experts to understand and utilize Cool Roofs, by providing technical information, tools and answers to common questions. The following examples showcase successes in the field.
Case-Studies
Ahmedabad’s Cool Roof Initiative, as part of its ‘Heat Action Plan‘ aims to convert 3000 roofs in 6 zones to Cool Roofs. This is being undertaken by city staff and student volunteers. They are using white lime paint, which costs as little as ₹0.50 per square foot 5.
Hyderabad is also witnessing a Cool Roof Initiative as part of its Building Energy Efficiency Program. The Pilot included 25 city roofs in low income areas. A High-Density Polyethylene (HDPE) cool roof membrane (costing ₹13 per square foot in Hyderabad) was supplied by Dupont as part of their CSR initiative 1.
The Indore and Surat ‘Cool Roof Project‘ is using local success stories to make a case for cool roof policies in the future. The project consists of over 100 households. They are using simple materials such as lime concrete, broken earthen pots, China mosaic tiles 6.
A Joint study was conducted by International Institute of Information Technology, Hyderabad (IIIT) and Lawrence Berkeley National Laboratory (LBNL) on 2 office buildings in Hyderabad. The studies saw a drop of approximately 20°C in Roof surface temperatures after application of cool roof coating 2.
We leave you with the following questions –
Have you used ‘Cool Roofs’ in your Project? Do you know of any projects using ‘Cool Roofs’?
What Benefits have you felt after application of the ‘Cool Roof’ technology?
What Problems did you face?
What kind of Assistance if any, did you receive from the Government or any other organisations?
Let us know! We would love to provide a platform, to showcase your project and spread more useful information.
Jaiswal A, Bhagavatula L, Awasthi A, Sarkar S. Keeping It Cool: Models for City Cool Roof Programs. National Resources Defense Council. https://on.nrdc.org/2jLgLPJ. Published 2018. Accessed November 27, 2018.
International Institute of Information Technology Hyderabad, Administrative Staff College of India, Indian Institute of Public Health Gandhinagar, Mahila Housing SEWA Trust. Keeping It Cool: How Cool Roofs Programs Protect People, Save Energy and Fight Climate Change.; 2018. https://on.nrdc.org/2FIxYas. Accessed November 27, 2018.
International Institute of Information Technology Hyderabad, Administrative Staff College of India, Indian Institute of Public Health Gandhinagar, Mahila Housing SEWA Trust. Issue Brief – Cool Roofs: Protecting Local Communities and Saving Energy.; 2018. http://www.phfi.org. Accessed November 27, 2018.
These faces of the building are difficult to shade, as they receive low angle rays from the rising and setting sun. Common shading features such as horizontal projections, usually fail in such situations. Our 3 case-studies explain methods to address these tricky areas of the building.
Addressing East, West Facades; Graphics: Credits below
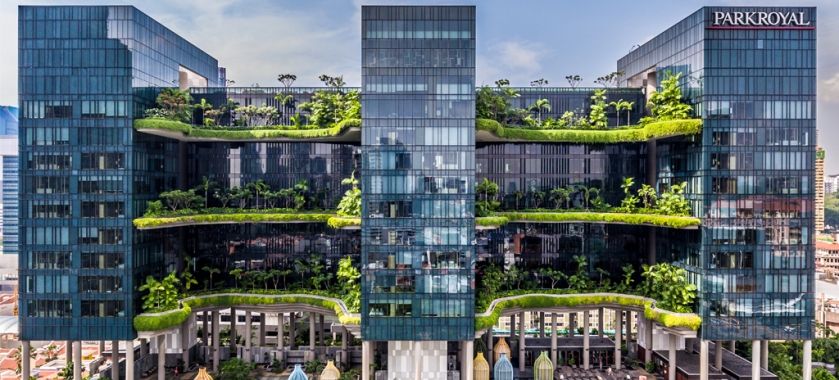
Park Royal – The East, West facades are shaded using self-shading, achieved due to the E-shape projections from the Plan.
CapitaGreen – Of all the vertical green on the facade, larger amount of greenery is provided on the East, West facades to shade them.
Cleantech One – Sky gardens and planters on these facades help cool the labs and create pleasant breakout spaces.
Credits: Graphics : All graphics are produced as part of a team project for M.Sc. Integrated Sustainable Design at National University of Singapore (Building Semester – Stage 1 – Complex Living Systems). Group Members – Gajender Kumar Sharma, Aditi Bisen, Huang Hongbo, Zhao Yanming Text: Aditi Bisen
This is Segment 3 of our Chain of posts focused on ‘Energy @ the Building Scale’.
[Extension of Part 4/5: The Red System (Energy), Singapore – Published: 28th May 2018]
CapitaGreen in the Central Business District of Singapore [Image via GreenA Consultants, Singapore]CapitaGreen is a 82,000 sq.m. GreenMark Platinum building. It is a 43-floor skyscraper in the Central Business District of Singapore designed by Architect – Toyo Ito (2). It is at less than 10-minutes walk, South-East from Park Royal, Pickering – our previous project under study. The Skyscraper has multiple sustainable features as elaborated below; which lead to energy savings of around 4.5 GWh /year (1).
This is Segment 2 of our Chain of posts focused on ‘Energy @ the Building Scale’.
[Extension of Part 4/5: The Red System (Energy), Singapore – Published: 28th May 2018]
Park Royal Hotel, Pickering, Singapore [Image via Nylon Singapore]Park Royal at Pickering is a 7500 sq.m. Hotel in the thick of Singapore’s Central Business District, facing a now famous Hong Lim Park. The hotel has various sustainable features (elaborated below), that lead to approximately 30 per cent (f) energy savings in operation (using a conventional building of similar scale and functions as base case). Due to these features, it has received the GreenMark Platinum rating certification from Singapore’s Building Construction Authority.
This post is an Introduction, that leads to a chain of articles in the coming weeks, focusing on Energy @ the Building Scale. We felt this important scale merited further mention [an extension of ‘Part 4/5: The Red System (Energy), Singapore’ – Published: 28th May 2018]. These articles are also part of our effort to explore and possibly prove that ‘Passive strategies’ for Architecture are still vital for Energy efficiency and Sustainability in today’s world.
DPR’s Phoenix regional office – North and East facades; Sources: 1, 2
DPR’s Phoenix office cleverly combines passive strategies like Natural Ventilation and daylighting, with Active smart controls to create a Net Zero certified building that also acts as a Living Laboratory. Having achieved this in the harsh hot dry climate of the Sonoran desert, sprouts hope for Passive design.
This is part of a series of posts based on scripts, written for class presentations during our Masters in Integrated Sustainable Design at National University of Singapore.
The class had to analyse various complex systems in Singapore, as a precursor to the Design problem in Studio. The systems included are – Red (energy), Blue (Water), Green I (Biodiversity), Green II (Food) and Grey (Public Space).
The following posts elaborate on the Red System.
Part 4/5: System Structure
Welcome to Part 4/5 of our series on the Energy System of Singapore. Part 1/5 established that the system has a gap at the neighborhood scale, that it is highly centralized and the largest demand sectors are Industrial and Commercial. Part 2/5 analysed the timeline of the system from the 1800s to present day, and looked on to the future – with a focus on important policies and events, and their corresponding effects.
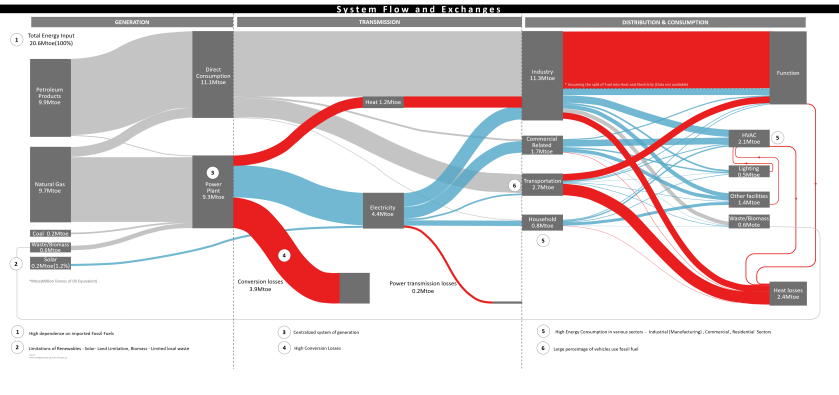
Part 3/5 looked more deeply into the System’s Flows & Exchanges. Important findings were that there is a high dependence on fossil fuels mainly Petroleum Products and Natural Gas for both direct consumption and generation of electricity. Also, despite efficient gas turbines for electricity generation, there are high conversion losses of up to 40 per cent as heat. However, the transmission losses remain low. A large percentage of transportation is also powered using fossil fuels. Within sectors, the highest consumption is for air-conditioning loads. Considerable waste heat is generated from processes, adding to environmental heat and affecting micro-climate.
Moving on from this understanding, in this post we explore the System Structure in greater detail on 3 scales – Island, 10 km X 10 km and Building.
System Structure on Regional and Island Scale; Graphics: Credits below
This is part of a series of posts based on scripts, written for class presentations during our Masters in Integrated Sustainable Design at National University of Singapore.
The class had to analyse various complex systems in Singapore, as a precursor to the Design problem in Studio. The systems included are – Red (energy), Blue (Water), Green I (Biodiversity), Green II (Food) and Grey (Public Space).
The following posts elaborate on the Red System.
Part 3/5: System Flows and Exchanges
Welcome to Part 3/5 of our series on the Energy System of Singapore. Part 1/5 established the objective and boundary condition of the system. It then identified the Elements, and Flows & Exchanges between them, to set relevant scales of study and understand critical functions. We found that the system has a gap at the neighborhood scale, it is highly centralized and the largest demand sectors are Industrial and Commercial. Part 2/5 went deeper into the analysis by looking at the timeline of the system from the 1800s to present day, and looking to the future. The timeline reflected important policies and events, and their corresponding effects using maps at Regional and Island scales.
Moving on from the above base, this post delves deeper into the System Flows and Exchanges. The Analysis is divided into 3 sections – Generation, Transmission, Distribution & Consumption.
Energy System Flows & Exchanges Sankey Diagram; Generation, Transmission, Distribution & Consumption in detail below; Graphics: Credits below; Data Sources: 1, 2
This is part of a series of posts based on scripts, written for class presentations during our Masters in Integrated Sustainable Design at National University of Singapore.
The class had to analyse various complex systems in Singapore, as a precursor to the Design problem in Studio. The systems included are – Red (energy), Blue (Water), Green I (Biodiversity), Green II (Food) and Grey (Public Space).
The following posts elaborate on the Red System.
Part 2/5: System in Time
Welcome to part 2/5 of our ongoing series, on the Energy system of Singapore. The last post established the objective of the system. We then started analysis by first establishing a boundary condition and later identifying the system’s Elements, and the Flows & Exchanges between them. This was done to set relevant scales of study and understand critical functions such as generation, transmission, consumption. We gathered that there is a global scale and 3 local scales for this system – Island, 10 km X 10 km and building. There is a gap at the neighborhood scale. We also found out that the system is highly centralized with high demand from various sectors, the largest being Industrial and Commercial.
Keeping this base work in mind, we move deeper into the analysis and understand the timeline of the system starting all the way from the 1800s to present day. We also look at future aims and targets to address present issues.